Gantt Chart in Cordys
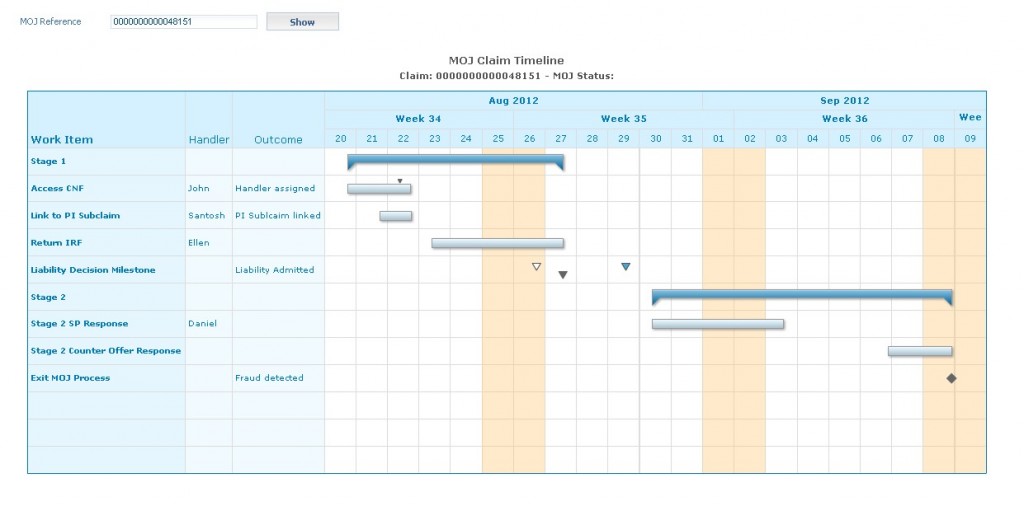
To some extent, the Cordys platform offers a direct support for charting (single/multi-series, gauge, BAM charts). Your project though might require extended support/other types of graphs. For example, the requirement might come up to depict the timeline of a BPM/Case process into a Gantt Chart.
Example:

The Cordys platform comes with a version of Fusion Charts (<Install>\Web\wcp\flash\fusion). One of the Fusion charts is the Gantt Chart widget. It is quite an effort though to produce the low-level XML to make up a chart. To ease things, I’ve uploaded a Cordys project which offers a high-level API to produce a Gantt Chart.
Google Code: http://code.google.com/p/cordysganttchart/
GitHub: https://github.com/kekema/cordysganttchart/
It comes as a server-side component (Java API), and has an example class and XForm to illustrate on how to request for the chart from server and populate it client side. Quickly you can build up a chart by adding a calendar with timescales/non-working days, columns, rows and row items (tasks, milestones, events). See for details the project documentation.
Leave a Reply